Every dataset Verdelora produces is organized spatially.
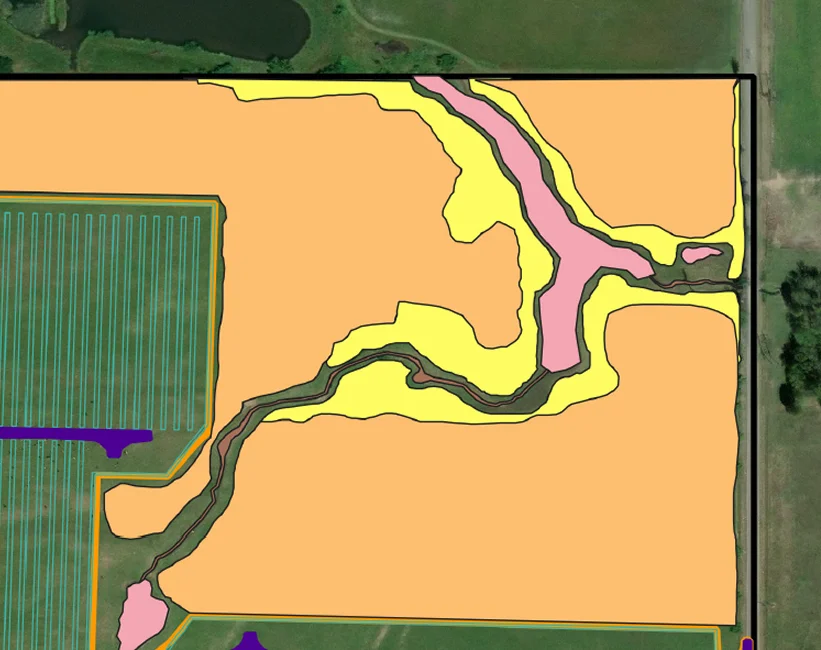
We maintain project geodatabases covering plant communities and ecological sites, seeding and treatment units, and wildlife detections. They also hold soil sampling locations, monitoring plots and transects, and designed and as-built disturbance boundaries. Attributes follow controlled vocabularies for species, cover class, and treatment type, so records entered across seasons and by different observers use the same terms.
The geodatabase carries a site from design through monitoring.
Repeat events are stored as related records against a persistent feature. A monitoring plot established in year one keeps a stable identifier. Observations accumulate against it, so trend can be calculated across the full monitoring period. Sampling and treatment locations are recorded at positional accuracy sufficient for field relocation. Plot documentation allows a different observer to return to the same location in a later season.
Geometry drives quantity. Seeding unit acreage calculated from the geodatabase sets the pure live seed quantity procured and the application rate verified in the field. Designed disturbance compared against as-built disturbance produces the temporary and permanent acreage figures that compliance reporting requires. Map products are prepared for defined audiences: submittal figures for agency review, work area figures for contractors, and status layers that track treatment, seeding, and monitoring across a portfolio.
We use cookies to ensure that we give you the best experience on our website. If you continue to use this site we will assume that you are happy with it.